Articles
- Page Path
- HOME > IGEE Proc > Volume 2(1); 2025 > Article
-
Article
The Current Status and Future of Yonsei University's Transition to a Carbon-Neutral Campus: Focused on Energy Consumption and Greenhouse Gas(GHG) Emission Characteristics - Haeyeong Choi*
-
IGEE Proc 2025;2(1):31-42.
DOI: https://doi.org/10.69841/igee.2025.009
Published online: February 27, 2025
Chemical and Biomolecular Engineering, Yonsei University, Seoul, Republic of Korea
- *Corresponding Author: Haeyeong Choi, E-mail: haeyeong0404@yonsei.ac.kr
• Received: January 16, 2025 • Revised: February 13, 2025 • Accepted: February 14, 2025
© 2025 by the authors.
Submitted for possible open-access publication under the terms and conditions of the Creative Commons Attribution (CC BY) license (http://creativecommons.org/licenses/by/4.0/).
- 1,848 Views
- 45 Download
Abstract
-
- This study presents the current status of Yonsei University’s efforts toward carbon neutrality, with a focus on energy consumption and greenhouse gas (GHG) emission characteristics. Based on these findings, the study proposes directions and solutions for transitioning to a carbon-neutral campus from three perspectives: energy-saving strategies, changes in governence , educational and academic accessibility. Among them, the first one is the main focus of this study.
- On November 27, 2024, Yonsei University participated in the 'Joint Declaration Ceremony of Four Universities for the Sustainable Campus Initiative', held in Global Green Growth Institute(GGGI). In declaration, Yonsei University committed to the fulfillment of its environmental and social responsibilities and laying a foundation for addressing global challenges with Seoul National University, Korea University, and Postech.
- Analyzation was conducted from various perspectives: energy consumption, GHG emission, the correlations between the two, energy usage patterns by building types, and change in the pattern of energy usage over a year and a month. The following briefly presents three scenarios from different perspectives. Firstly, Buildings - especially STEM and research centers - and energy fixing facilities should be strictly managed to reduce energy. Plus, assessing energy consumption during non-peak hours, such as late at night and on weekends, is also needed to determine if it aligns with actual activities. Installing more energy-efficient heating/cooling systems. Secondly, enhancing governance structure dealing with this issue is suggested as the solutions. It can be efficiently conduced by leveraging its existing systems in a way to collaborate and discuss together. And they should annually publish carbon-neutral scenarios, ESG reports, and current status of renewable energy. They also should improve the transparancy and accuracy of publicly available energy-related information. Third, the study suggests increasing financial support for students and researchers in environmental-related departments. In addition, fostering interest among the broader Yonsei community and establishing a symbolic Carbon Neutrality Center are also proposed.
- This study presents the current status of Yonsei University’s efforts toward carbon neutrality, with a focus on energy consumption and greenhouse gas (GHG) emission characteristics. Conclusively, this study is going to suggest three scenarios, each presenting a different approach toward a carbon-neutral university. Three suggested perspectivs are energy-saving strategies, changes in governence , educational and academic accessibility. And this study primarily focus on the first one.
- Since South Korea declared carbon neutrality on October 28, 2020, significant steps have been taken, including the enactment of the Carbon Neutrality Framework Act on August 31, 2021, and the announcement of the Carbon Neutrality and Green Growth Basic Plan on March 22, 2023. In alignment with these developments, renowned universities worldwide have been implementing carbon-neutral campus initiatives. Following the launch of the global campaign "Race to Zero" by the UN in June 2020, 548 universities worldwide declared carbon neutrality over the subsequent three years. Domestically, Kyungpook National University was the first to declare "Carbon Neutrality 2040" in 2021 (Cho Hyewon, 2024). On November 27, 2024, Yonsei University, together with Seoul National University, Korea University, and POSTECH, participated in the "Joint Declaration Ceremony of Four Universities for the Sustainable Campus Initiative', held in GGGI. And they committed to addressing global challenges and fulfilling the environmental and social responsibilities of higher education institutions.
- Universities fall under the "Buildings" sector, one of the six key carbon reduction areas identified in South Korea's national carbon emissions strategy (conversion, industry, transportation, buildings, agriculture/fisheries, and waste) (Yun, 2024). Seoul National University has ranked first in building energy consumption for ten consecutive years since records began (Seoul Metropolitan Government Energy information, 2022). As of 2022, Seoul National University consumed approximately 54,590 TOE annually, while Yonsei University and Korea University consumed 20,978 TOE and 20,672 TOE, ranking 16th and 17th, respectively. Among the top 25 energy-consuming buildings in Seoul, universities and university hospitals account for approximately 40%. Although their energy usage per unit area is relatively low, university campuses remain significant sources of greenhouse gas emissions.
- The international university evaluation criteria of QS underwent changes starting in 2024. As shown in Table 1, the weights of Academic Reputationand Faculty-Student Ratio, which previously accounted for 40% and 20% of the total score, respectively, were reduced to 30% and 10%, while new criteria, including Sustainability, were introduced. Yonsei University ranked 56th overall in the 2024 QS rankings but placed a much lower 103rd in the newly established Sustainability Rankings. Referring to Figure 1, its scores for Environmental Sustainability, Environmental Education, and Environmental Researchwere 165th, 82nd, and 98th, respectively, significantly lower than other leading universities. Given that 40 of the top 50 universities in the 2024 QS rankings have already declared carbon neutrality, Yonsei University can no longer overlook the importance of carbon neutrality for sustainable and long-term development.
- This study aims to analyze the characteristics of energy consumption and greenhouse gas (GHG) emissions in Yonsei University. Prior to the formulation of specific scenarios and medium- to long-term plans for achieving carbon neutrality, it is essential to conduct a thorough analysis of the current situation and foster public discourse. Based on this analysis, Yonsei University must undertake the following actions. First, the university administration must take the lead in managing and reducing energy consumption and greenhouse gas (GHG) emissions. This can be achieved through measures such as improving energy efficiency, controlling the growth of energy use, and increasing the share of renewable energy. Second, it is imperative to strengthen the governance system required for the establishment and execution of these strategies. Third, investments must be made to promote research and education related to carbon neutrality and sustainability.
1. Introduction
- A Source of Data
- To analyze the characteristics of energy consumption and GHG emissions at Yonsei University, two primary sources of information were utilized. Annual data were obtained from records managed by the Facilities Department, while monthly and daily data for individual buildings were sourced from the Yonsei Energy Platform Service (YEPS). YEPS provides real-time information on electricity consumption for buildings through power meters, allowing users to manually collect data for daily, weekly, and monthly energy use on a building-by-building basis (Yonsei Energy Platforms Service, 2024). Figure 2 presents a GHG map derived from real-time electricity usage data provided by YEPS. Buildings are color-coded in descending order of electricity consumption: red, orange, yellow, and green. Red indicates high electricity consumption, primarily in STEM buildings or research facilities, which consume substantial amounts of electricity.
- Scope of Study
- This study is limited to the Sinchon Campus of Yonsei University. It is because energy consumption and GHG emissions for the International Campus in Songdo and the Mirae Campus in Wonju are managed separately by their respective Facilities Departments.
- Calculation Method
- The data provided by YEPS exhibit significant variability, such as the absence of recorded electricity usage during certain periods. Furthermore, the platform offers information for only 42 out of more than 54 buildings in Sinchon Campus. Specifically, the following is the buildings excluded from YEPs: Billingsley Hall, Nonji Hall, Seongam Hall, Stimson Hall, Appenzeller Hall, Allen Hall, the Institute of Language Research and Education, the Yu Eok Gyeom Memorial Hall, Lee Yun Jae Hall, Pinson Hall, Hankyung Hall, and the IBS Hall.
- To address this issue of low reliability, certain assumptions were made. To estimate annual electricity usage for individual buildings, data from June and July 2024—months with minimal variability—were used. June represents a period of limited air conditioning usage, while July sees significantly higher air conditioning demands, approximately 1.5 times those of June. Considering the W-shaped trend in annual electricity consumption caused by seasonal heating and cooling, the annual usage was estimated using the formula: Annual usage = (June average energy use x 183) + (July average energy use x 182). Using this method, the electricity consumption of the 42 buildings was estimated to be approximately 6,900 TOE. This figure contrasts significantly with the total electricity consumption of over 18,000 TOE reported for all buildings on the Sinchon Campus in 2023. This study only focus on the rankings and ratios of building's energy consumption rather than their actual amounts, in order to minimize the statistical fallacies.
- Basic Information, Classification, and Unit Settings
- Table 2 and Table 3 present the overall status of Yonsei University's Sinchon Campus and the building classification method used in this study. As of April 2024, the Sinchon Campus comprises approximately 54 buildings with a total floor area of 633,651 m2. To analyze energy usage patterns by building characteristics, the buildings were classified into seven categories: STEM (science, technology, engineering, mathematic), humanities, research facilities, academic support facilities, student amenities, Student supporting facilities, administrative facilities, and the others.
- Table 4 and Table 5 categorize the energy consumption and GHG emissions of Yonsei University's Sinchon Campus into three sectors. This categorization facilitates the understanding and analysis of energy usage and GHG emission patterns. Table 4 presents the categorization of energy consumption into three sectors used in this study: electricity, energy fixing systems, and mobile facilities. Officially, electricity includes consumption in buildings and wastewater treatment plants. Energy fixing systems cover heating, cooling, and cooking powered by LNG and kerosene, while mobile facilities encompass transportation powered by gasoline, diesel, LPG, and CNG.
- Table 5 categorizes GHG emissions into three components: scope 1, scope 2, and scope 3.
- Direct emissions (scope1) refer to emissions from sources that are directly managed and controlled by the emitter, such as production facilities and vehicles owned and operated by Yonsei University. scope2 and scope3 encompass indirect emissions from facilities not owned by the emitter. Scope2 represents GHG emissions generated during external electricity production, which the emitter cannot directly control. In this study, scope2 includes only electricity consumption in on-campus buildings. When it comes to scope3, this study considers only the electricity usage for operating the on-campus wastewater treatment plant within scope3. While scope3 conventionally extends to include the entire chain, encompassing emissions from waste, commuting, business travel, and external vehicles, the estimation of these emissions is highly complex and uncertain.
- Table 6 outlines the relationships between various energy consumption units. In this study, the unit TOE (Tonne of Oil Equivalent) will primarily be used. TOE is a standardized energy unit based on the calorific value of one tonne of crude oil, enabling the conversion of various energy sources expressed in units such as kl, t, m³, and kWh into a common measure. Wh(Watt-hour) represents the energy consumed when 1 joule of energy is used per second for one hour. 1kWh (Kilowatt-hour) equals 1,000 Wh, and 1GWh (Gigawatt-hour) equals 1,000 kWh. For GHG emissions, the unit tCO2eq (tonne of CO2 equivalent) is used uniformly. Although GHG emissions include various gases such as CH4, N2O, and HFCs, it is common practice to express them as CO2 equivalents (CO2eq) by converting the emissions of other gases to their CO2 equivalence. CO2 accounts for 94.4% of South Korea’s annual GHG emissions, justifying this standardization (Environment Statisitcs Portal, 2024).
2. Methods
- Energy Consumption Status
- Table 7 presents average annual energy consumption of each sector and its percentage during 2015–2023 in Yonsei University's Sinchon campus. Electricity usage in buildings accounted for the largest portion at 16,434 TOE (80.8%), followed by energy fixing systems using LNG for heating and cooling, which accounted for 3,340 TOE (16.4%). Other sources, including LNG for cooking, diesel for mobile facilities, electricity for wastewater treatment, CNG, kerosene for heating, gasoline for mobile facilities, and LPG (butane), followed in descending order.
- Table 8 focuses exclusively on electricity and natural gas (LNG) consumption during nine years. These two energy sources represent over 99% of total energy consumption. Over this period, the energy consumption ratio of electricity to LNG has remained approximately 4.7:1.
- Table 9 illustrates total energy consumption from electricity in buildings and its ratio, during 2015–2023 in Yonsei University's Sinchon Campus. This percentage has consistently increased and now exceeds 80%. This indicates that managing electricity consumption in buildings is the most critical aspect of energy management, followed by the management of LNG usage.
- Table 10 compares the total annual electricity consumption of Seoul, the annual electricity consumption per household in Seoul, and Yonsei University’s total annual electricity consumption (based on the Seoul Statistics Information System, 2022). Yonsei University accounts for approximately 0.4% of Seoul's total electricity consumption. When compared to the annual electricity consumption per household in Seoul, Yonsei University's consumption is significantly larger, making this contrast immediately evident.
- As previously mentioned, universities fall under the "Buildings" sector, one of the six key areas identified in the national carbon emissions reduction strategy (conversion, industry, transportation, buildings, agriculture/fisheries, and waste) (Yun, 2024). According to the enforcement decree of the energy use rationalization act, energy-intensive buildings refer to buildings in which the total annual consumption of fuel, heat, and electricity is more than 2,000TOE. Yonsei University qualifies as an energy-intensive building, with an average annual energy consumption of approximately 20,000 TOE over the past nine years. To effectively manage energy consumption on Yonsei University's Sinchon Campus, priority should be given to reducing electricity consumption in buildings. This can be achieved by increasing the supply of renewable energy or implementing energy efficiency measures. Subsequently, strategies should also be developed to reduce the use of natural gas (LNG).
- Greenhouse gas (GHG) Emission Status
- Table 11 organizes GHG emissions, allocations, shortage of GHG emission rights, and estimated purchase cost of GHG emission rights, during 9 Years (2015–2023), based on Statement, in Yonsei University Sinchon campus. South Korea operates a carbon market and the Emissions Trading System (K-ETS) under which the government sets a cap on total carbon emissions. Emitters are allocated emission rights annually, and they can trade these rights within the market (Hwang, 2024). Yonsei University also participates in this system, purchasing additional GHG emission rights if it exceeds its allocation and selling surplus rights if it underuses its allocation. The trend in annual GHG emissions reveals a consistent increase, surpassing 45,000 TOE in 2023, except during the COVID-19 pandemic years of 2020 and 2021, when campus activity was significantly restricted. The year 2017 saw the highest emissions relative to the allocation, with more than KRW 100 million spent on purchasing GHG emission rights, highlighting the financial losses incurred by excessive emissions.
- Table 12 breaks down the amount of GHG in each scope and its ratio in 2023. Scope1 (direct emissions) accounts for approximately 16.3% of the total, encompassing emissions from energy fixing facilities (heating, cooling, cooking) and mobile facilities (gasoline, diesel, LPG, LNG). Scope2 (indirect emissions), generated by electricity supplied from external power facilities and used in campus buildings, constitutes 83.6% of the total, making it the largest contributor. Scope3 emissions, which in this study include only electricity usage in the campus wastewater treatment plant, represent a negligible 0.1%.
- These findings emphasize the critical need to manage emissions of scope2. As over 80% of electricity is consumed in campus buildings, reducing emissions of scope2 can be achieved by optimizing building heating and cooling systems or increasing the adoption of renewable energy sources such as geothermal or solar energy. To properly manage emission of scope1, implementing CCUS(carbon capture, utilization, and storage) technologies in buildings could directly absorb GHG emissions generated on campus, offering a direct approach to mitigating emissions.
- Correlations between Energy Consumption and Greenhouse Gas (GHG) Emission
- Figure 3 provides a comprehensive overview of the nine-year trends in total annual energy consumption (TOE) and GHG emissions (tCO2eq) in Yonsei University's Sinchon campus. While energy consumption and GHG emissions are not perfectly proportional, it is evident from the figure that increases in energy consumption generally lead to higher GHG emissions, which aligns with common sense. From 2015 to the present, excluding the COVID-19 pandemic years of 2020 and 2021, Yonsei University has experienced a growing trend in both energy consumption and GHG emissions.
- Figure 4 illustrates the energy consumption and GHG emission processes at Yonsei University in 2023 as a schematic diagram. Most of the energy supplied by external power generation facilities is in the form of electricity, and the resulting GHG emissions are predominantly categorized as scope2 (indirect emissions). Additionally, the energy derived from natural gas (LNG) is primarily used as city gas, with its associated GHG emissions classified as scope1 (direct emissions).
- Figure 5 presents a balance model of energy consumption and GHG emission of Yonsei University in 2023 . This is a reformulated version of Figure 4. This diagram provides a clearer representation of the energy flow and highlights the relative contributions of different energy sources and emission categories. These three figures present the close relations bewteen energy consumption and GHG emissions. They cannot be considered separately as most GHG emissions stem from energy consumption. Therefore, Yonsei University first needs to find ways to reduce energy usage. Following this, it can also explore direct carbon reduction strategies, such as installing mechanisms like CCUS in research centers or energy fixing facilities.
- Energy usage patterns by building types
- Over 80% of the campus's energy consumption comes from building electricity use (referring to Table 9). Therefore, analyzing the energy consumption characteristics of campus buildings is essential for developing future carbon-neutral scenarios. Both Figure 6 and Figure 7 present the electricity usage patterns of buildings on the Sinchon Campus, as identified through the Yonsei Energy Platform (YEPS). While there are 54 buildings on the Sinchon Campus, data is available for only 42 among them. Thus, this study only focus on the rankings and ratios of building's energy consumption rather than their actual amounts, in order to minimize the statistical fallacies.
- According to Figure 6, it is evident that nearly half of the energy consumption occurs in STEM buildings and research facilities. Figure 7 highlights the proportion of the top high 8 energy consumption buildings in terms of their share of total building count, floor area, and energy consumption. Although these buildings represent only 20% of all campus buildings, they account for over 50% of the total energy consumption. This indicates that Yonsei University should focus its energy consumption and GHG emission management efforts on STEM buildings and research facilities.
- Change in the pattern of energy usage over a year and a month
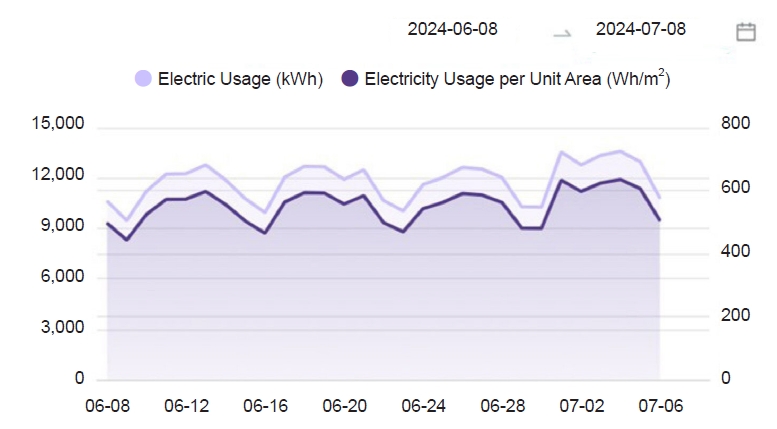
- Figure 8 and Figure 9 presents energy consumption trends for STEM and research facilities, monthly and annually, respectively. Figure 8 illustrates monthly energy consumption trend of the Science Hall, a representative STEM building, during June. The data reveals a recurring cycle of rises and falls in electricity usage, with a periodicity of seven days and distinct troughs occurring on weekends. This suggests that research equipment in STEM buildings operates continuously, even during nights and weekends when human activity is minimal, contributing significantly to energy consumption.
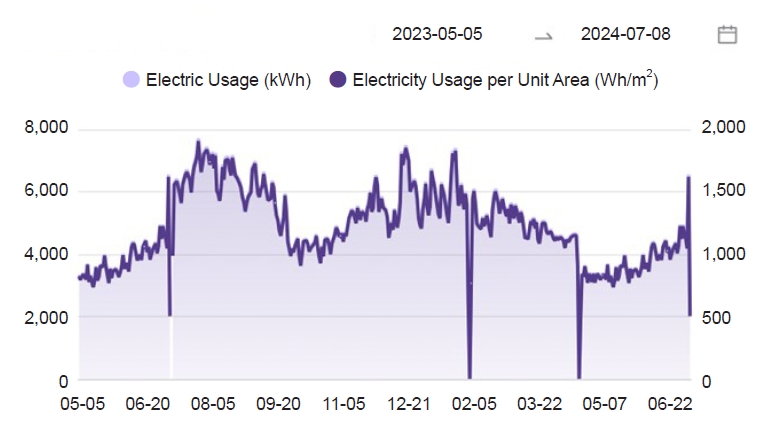
- Figure 9 shows annual energy consumption trend of the GS Industry-Academia Collaboration Building, a representative research facility, as observed from May 2023 to July 2024. The trend exhibits a "W-shaped" pattern, with significant increase between June and August and again between November and December. This phenomenon is attributed to seasonal transitions from spring to summer and autumn to winter. Given that student activitities decline during summer and winter breaks, it is evident that heating and cooling are the primary drivers of electricity usage in these periods.
- Shortly, energy consumption during late-night and weekend hours in STEM buildings and research facilities should be investigated to determine whether it corresponds to actual activity. Wasted energy should be managed and conserved accordingly. Additionally, strategies to reduce electricity usage for heating and cooling need to be explored. This could include installing more energy-efficient heating/cooling systems and assessing whether mismanagement leads to unnecessary energy waste.
- To estimate the potential energy savings from reducing wasted energy, the following scenario is assumed: If cooling, heating, and lighting were mistakenly left on for 10 hours (8 PM to 8 AM) in 31 non-STEM and non-research campus buildings for 10 days within a year, approximately 34 TOE (0.395 GWh) would be wasted. This accounts for about 0.2% of the total annual electricity consumption of all buildings on the Sinchon Campus in 2023. STEM and research facilities were excluded from this scenario since their energy assumptions remain high even at night, despite the absence of human activity.
3. Results
- This study proposes three scenarios for transitioning Yonsei University into a carbon-neutral campus with different perspectives: energy-saving strategies, changes in governence , educational and academic accessibility. They are mostly based on the energy usage and GHG emission characteristics analyzed in the Results section.
- The first scenario provides energy-saving strategies to overcome current problems and to be a carbon-neutral campus, which is a main result of the study. This approach focuses on both energy usage and GHG emission reduction perspectives, with particular emphasis on STEM and research facilities.
- Firstly, total energy consumption has been increasing. Specifically, electricity usage in buildings accounted for 80.8%, while energy fixing systems using LNG (heating/cooling) accounted for 16.4%, together representing 99% of the total energy consumption. Therefore, maximizing the use of renewable energy sources and improving the energy efficiency of buildings is essential. Subsequently, strategies to reduce the use of natural gas (LNG) should also be explored.
- Next, from the perspective of GHG emissions, scope2 should be the primary focus. However, as most GHG emissions stem from energy consumption, energy consumption and GHG emissions should be considered inseparately In other words, Yonsei University first needs to find ways to reduce energy usage and secondly explore direct carbon reduction strategies, such as installing mechanisms like CCUS in research centers or energy fixing facilities.
- Lastly, considering electricity usage patterns by building type, Yonsei University should prioritize STEM buildings as well as research facilities. It is particularly important to assess energy consumption during non-peak hours, such as late at night and on weekends, to determine if it aligns with actual activities. Any wasted energy identified should be addressed through proper management and conservation efforts. At the same time, strategies to reduce electricity usage for heating and cooling are necessarily required. They can be installing more energy-efficient heating/cooling systems and assessing whether mismanagement leads to unnecessary energy waste.
- The second scenario focuses on the change in governence including SDG-related organizations, which deal with sustainability issue of Yonsei University. By complementing the deficient part of current status, Yonsei University can be closer to achieve substantial sustainable University.
- Of course the Institute for Global Engagement & Empowerment (IGEE) exists currently, operating the Sustainable Development Research Center focusing on SDGs. However, investments directly linked to energy use and carbon neutrality remain in lack. Therefore, Yonsei University must enhance its governance structure by leveraging its existing systems.
- Specifically, collaboration and discussion between university administration, facilities department, and IGEE's Sustainable Development Research Center is needed. This framework should enable the publication of annual carbon neutrality scenarios, ESG reports, Green Reports, and current status of renewable energy as well as more accurate real-time updates on energy usage and GHG emissions.
- For example, Seoul National University, a leader in carbon neutral campus in Korea, has been publishing its Green Report under the ESG Committee since 2014. Additionally, its comprehensive GHG and energy management center provide publicly accessible information. It includes energy consumption, GHG emissions, member awareness about SDG, 10-year solar energy production data, and eco-friendly student activities. Like them, Yonsei University should formulate medium- and long-term plans to transition to a carbon-neutral campus as it clared in GGGI joint declaration ceremony.
- The third scenario involves revitalizing the educational framework to foster interest and engagement among campus members. Investment in education and academic access is essential, as the absence of concrete plans for transitioning to a carboon-neutral campus can be partially attributed to the lack of student interest.
- Firstly, this can be achieved through various means, such as idea competitions, scholarship programs, talent development projects, and use of both internal and external social media. Along with these initiatives, it is essential to expand financial support to students and researchers in environmental-related departments, and to foster interest among the broader Yonsei community.
- Secondly, establishing a symbolic Carbon Neutrality Center is worthy of being considered, which operates without emitting any GHG. It would serve as a hub for collaboration among faculties and students not only in Yonsei University but also from other colleges.
- Lastly, publicly disclosing energy consumption by college buildings and implementing incentives—such as tuition reductions or scholarships for students in colleges that achieve the highest energy savings each semester—can also be effective strategy for promoting energy conservation.
4. Discussion


Figure 3.Yearly change of total energy consumption(TOE) and GHG emissions(tCO2eq) in Yonsei University Sinchon campus


Figure 6.Proportion of each standard for the top 8 Energy-Consuming Buildings on the Sinchon Campus of Yonsei University

Figure 7.Proportion of three standards for the top 8 Energy-Consuming Buildings on the Sinchon Campus of Yonsei University : the number, the gross area, electric consumption


Table 1.Change of QS World University Rankings Criteria from 2023 to 2024
Table 2.Status overview of buildings on Yonsei University: Campus Area, Total Building Floor Area, Number of Buildings
| Variables | m2 only for area |
|---|---|
| Campus Area(school grounds only included) | 964,976 |
| Total Building Floor Area | 633,651 |
| Number of Buildings | 54 |
Table 3.Building Classification
Table 4.Classification of Energy Consumption Sectors
Table 5.Classfication of Greenhouse Gas Emission Scopes
Table 6.Units of Energy Usage
| Units of energy usage | ||||
|---|---|---|---|---|
| TOE | kWh | GWh | kcal | cal |
| 1 | 11630 | 0.01163 | 10000000 | 10000000000 |
Table 7.Average Annual Energy Consumption of Each Sector and its Percentage During 2015–2023 in Yonsei University’s Sinchon Campus
Table 8.Energy Consumption from Two Sectors: Electricity and LNG During 2015–2023 in Yonsei University’s Sinchon Campus
Table 9.Total Energy Consumption from Electricity in Buildings and Its Ratios During 2015–2023 in Yonsei University's Sinchon Campus
Table 10.Comparison of annual power consumption in 2022: Seoul City, Per Household, and Yonsei University
Table 11.GHG Emissions, Allocations, Shortage of GHG Emission Rights, and Estimated Purchase Cost of GHG Emission Rights, During 9 Years (2015–2023), based on Statement, in Yonsei University Sinchon Campus
Table 12.Amount of Greenhouse Gas Emissions Per Scope, with Ratios
| tCO2eq | % | |
|---|---|---|
| Scope1 (direct emissions) | 3,584 | 16.3% |
| Scope2 (Indirect emissions) | 18,349 | 83.6% |
| Scope3 (other indirect emissions) | 24.8 | 0.1% |
- Cho, H. (2024). Analysis of International Carbon-Neutrality Campus Cases - A Case Study on Comprehensive Universities in the United States. Journal of Appropriate Technology, 10(1), 56-72. https://doi.org/10.37675/jat.2023.00482Article
- Hwang, S. (2024), 「Carbon Market」, OJERI BOOKS, 85-86.
- Ministry of Environment. (2024.07.12). Trends in emissions by sector of greenhouse gases in the country. Environment Statistics Portal. https://stat.me.go.kr/portal/stat/easyStatPage/DT_106N_99_2800025.do
- Seoul Metropolitan Govenment. (2022). Energy Statistics – Status of Energy-Intensive Buildings. Seoul Metropolitan Government Energy Information. https://energyinfo.seoul.go.kr/energy/buildSaverate?menu-id=Z040300
- Yun, S. (2024). Understanding the Characteristics of Energy Use and Greenhouse Gas Emissions at Seoul National University in Preparation for the 2050 Carbon Neutral Transition and 2030 NDC. Journal of Appropriate Technology, 10(1), 20-31. https://doi.org/10.37675/jat.2023.00479Article
- Yonsei University. (2024.07.09). Yonsei Energy Platforms Service. https://yeps.yonsei.ac.kr/
References
Figure & Data
References
Citations
Citations to this article as recorded by 
 PubReader
 ePub Link
 Cite
Cite